Class gait analysis Group gait analysis
|
Class Walking Data:
https://docs.google.com/spreadsheets/d/150b1-yV3A_sxjVM_x5nBJOxQmjUJ6iwnHH4JuQfsgto/edit#gid=1928711889
https://docs.google.com/spreadsheets/d/11Vi-5BI6Pan_hd_4M3LkNB4F98hUP6svYFpqDxExO_E/edit#gid=0
What We Did: Each group took their gait data and everyone put it on the same spread sheet. We had to compare eachothers data and create a model to help us predict the height of someone, given their data. I put the x data from six different groups and put it on one spreadsheet. Then I graphed it. I looked at what each groups data looked like charted and compared it to their height. The less amount of bumps someone had in the line created from graphing their data, the less amount of steps they take and the taller they are.
Predictive Model To Determine An Unknown Height: By looking at the class gait data, I found that the taller someone is, the less amount of steps they take. Where there is a bump in the graph, that indicates a step taken. In the data I compared, Ethan is the tallest and has the least amount of bumps. You can graph someone's data and compare it to the known data and known height to estimate their height. 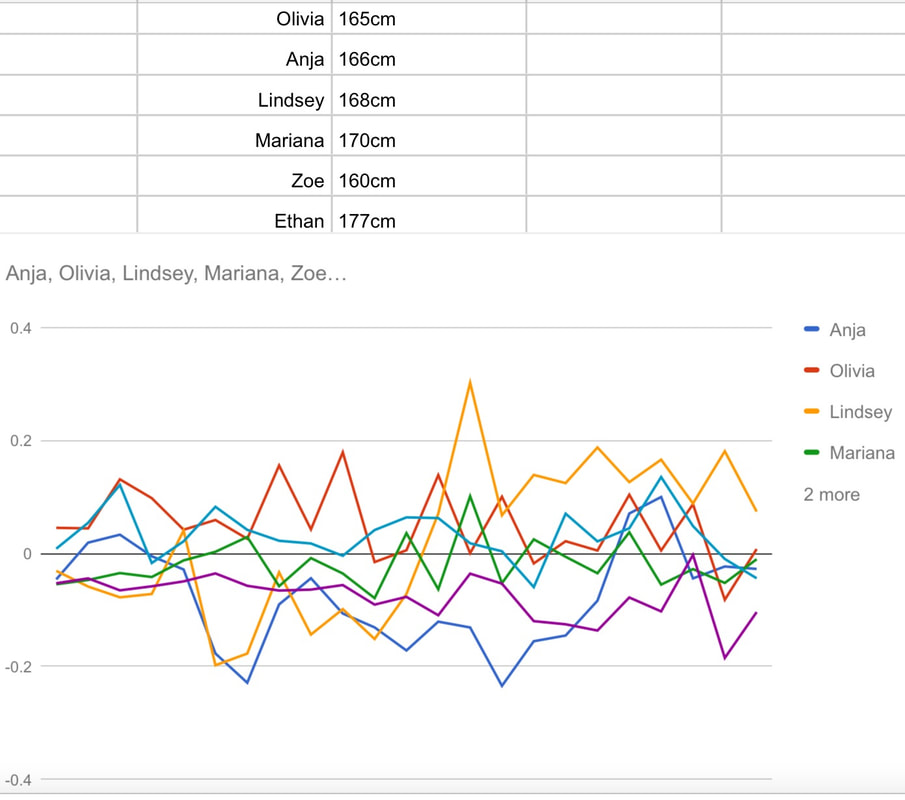
______________________________________________________________________________________
Reflection: During the class gait analysis, I had a difficult time creating a chart to compare all of the data. I was able to make a chart, but I wasn't able to read it. With some help, I was able to figure out how to create a chart that was readable; I had to put the x, y, and z data in separate charts.
Everyone in the team was given the opportunity to contribute ideas and participate. Everyone cooperated and helped eachother understand the material. I also tried to meet my dealines and ask for help if I needed clarification. My team collaborated a little bit with other teams. Another team, helped us make a clear, readable chart because the one I tried making didn't make sense. It is very important to have the right data. It is important so you can estimate someones height, stride, etc. To design a better, more accurate experiment, I need to find a good way to strap the phone to my stomach and need each trial to be the same amount of time exactly. For comparing the class data, everything would be more accurate if we all took the same amount of steps/sec. While performing the experiment, we had a difficult time trying to make the data super accurate. I held the phone to my stomach, so maybe next time I could tape it to make it more stable. You also have to move the phone in order to start and stop the phone from recording data, so that affects our results. I would also try to take the same amount of steps and walk for the same amount of time next time. I had a difficult time working with google sheets. The first challenge I had was trying to put our data onto google sheets then I had a difficult time trying to put the data into a chart and making it so the chart made sense. |
Group Walking Data:
https://docs.google.com/spreadsheets/d/1bZeO3HxX-Z5jPCBf_TKS6Yd7m1o54X6lDWiEWw2Kv6U/edit#gid=0
What We Did: We downloaded an accelerometer app and put our phone to our stomach because that is our center of gravity. We then recorded the data/what happened between the 0-10 steps that I took. In addition, we measured my height, leg length, and stride. I am not sure what all the data meant which is something that I need to figure out. As I walked, I held the phone to my stomach. The data is probably not very accurate because the phone wasn't actually strapped down to my stomach and it might also not be very accurate because I had to flip the phone face up in order to stop the app from continuing to record after I took 10 steps. We had three trials so that we could compare the data.
______________________________________________________________________________________ Terms: Gait - a person's manner of walking (what we were measuring) Accelerometer - an instrument for measuring acceleration (we downloaded an accelerometer app and used it to to measures one's acceleration) Dynamicity - the quantification of variations in kinematic or kinetic parameters within a step. Metric - A quantitative indicator of a characteristic or attribute Symmetry - In terms of gait analysis, the quantification of differences between left-foot and right-foot steps Variability - In terms of gait analysis, the quantification of fluctuations from one stride to the next The X, Y, and Z axis are forms of acceleration. |
